Using Grafana
Our environment is configured, OCS Agents are running, and we have commanded them to acquire some data. We are now ready to configure Grafana. The configuration is not challenging, however dashboard configuration can be time consuming. We start with the first time setup steps.
Set a Password
When you first navigate to http://localhost:3000 in your web browser you will see the following page:
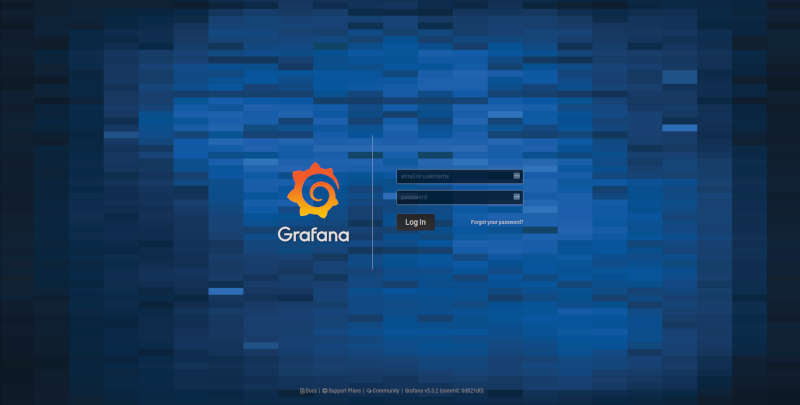
The default username/password are admin/admin. Once you enter this it will prompt you to set a new admin password. Select something secure, especially if your computer has a public IP address.
Note
Grafana can be a great way to check the housekeeping data at your site from anywhere you can access a web browser. For a more user friendly and secure connection you should setup a web server to proxy the connection to the Grafana container. This, however, is currently beyond the scope of this guide.
Configuring the Data Source
After setting the password you will end up on this page:
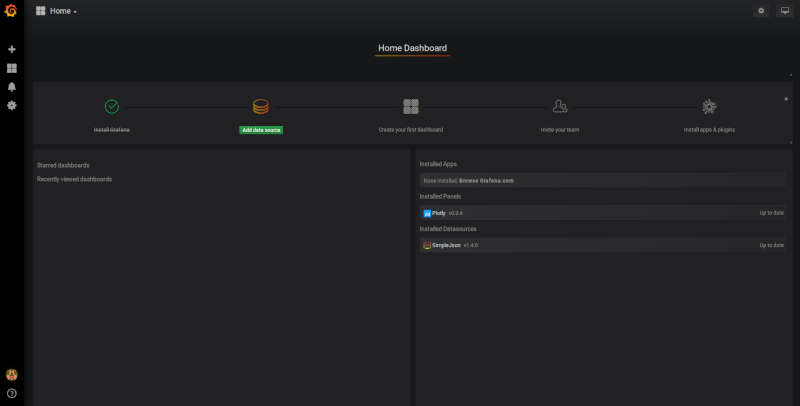
Click on the highlighted “Add data source” icon. (This is also accessible under the gear in the side menu as “Data Sources”.) You should then see this:
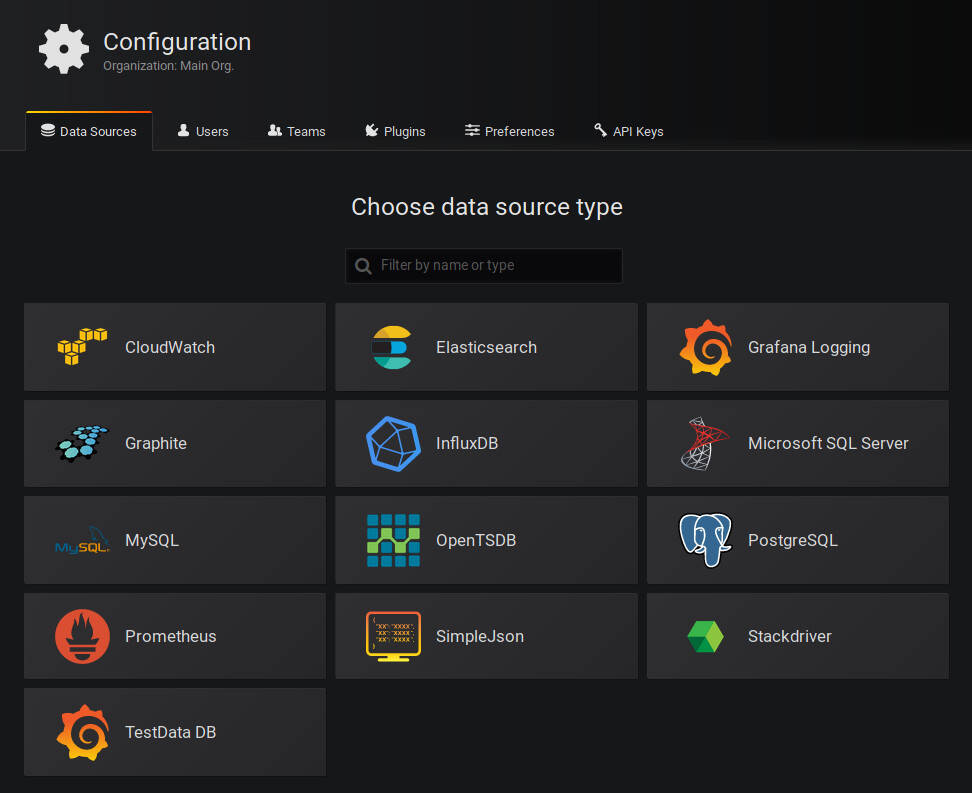
These are all the supported sources from which Grafana can pull data. We will use the SimpleJson source. Clicking on that icon will get you here:
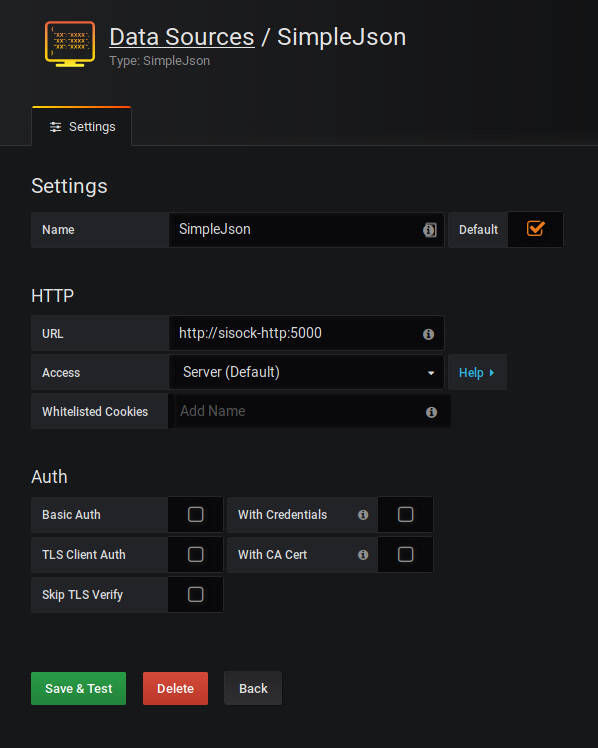
You can fill in what you want for a name, or keep the default. Make sure the
“Default” checkbox is checked, as this will be our default data source when
creating a new Dashboard. Finally, the URL must be http://sisock-http:5000.
This is the name for the HTTP server we set in the docker-compose.yml file
with the default port we assigned it.
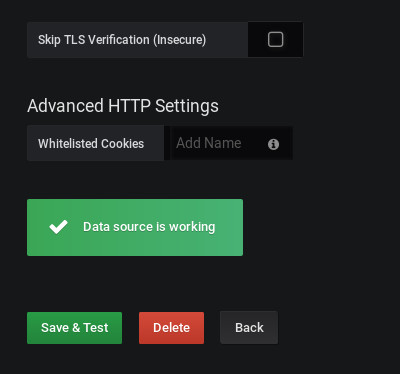
When you click “Save & Test” a green alert box should show up, saying “Data source is working”, like this:
If the Data Source is not working you will see an HTTP Error Bad Gateway in red:
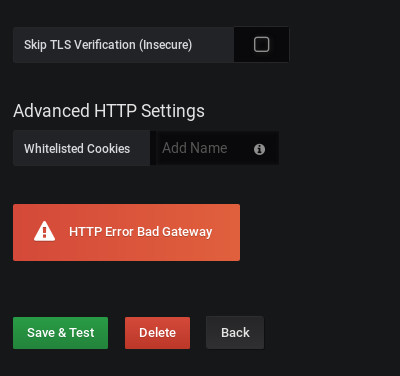
If this occurs it could be several things.
- Check the URL is correct
- Make sure you select the SimpleJson data source Type
- Check the sisock-http container is running
Configuring a Dashboard
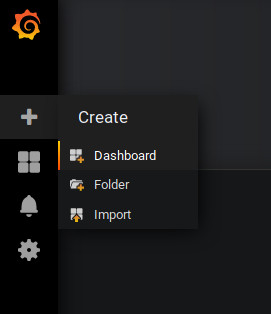
Now that we have configured the Data Source we can create our first Dashboard. If you press back on the previous screen you will end up on the Data Sources menu. From any page you should have access to the sidebar on the left hand side of your browser. You may need to move your mouse near the edge of the screen to have it show up. Scroll over the top ‘+’ sign and select “Create Dashboard”, as shown here:
You will then see a menu like this:
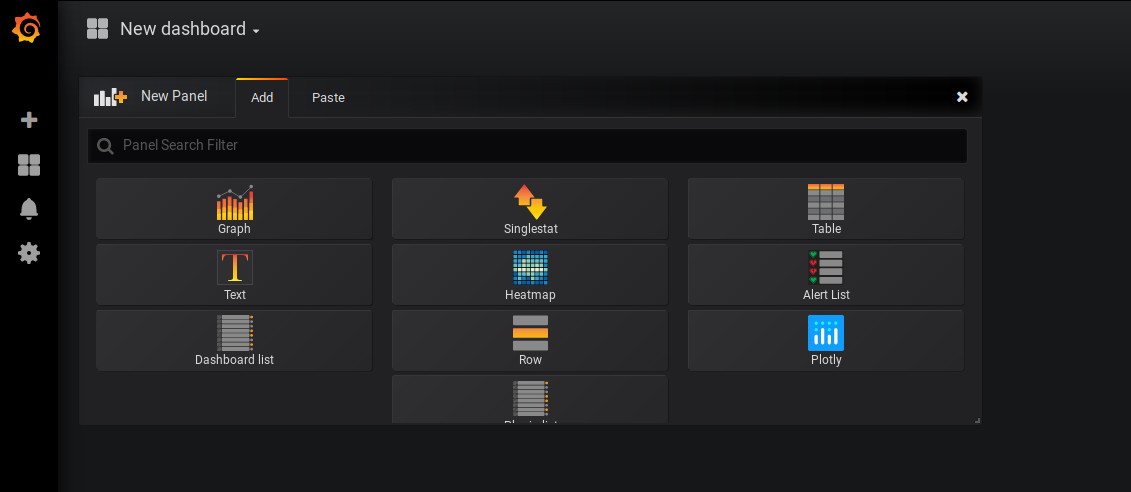
In this menu we are selecting what type of Panel to add to our Dashboard. We will add a Graph. When we first add the Graph it will be blank:
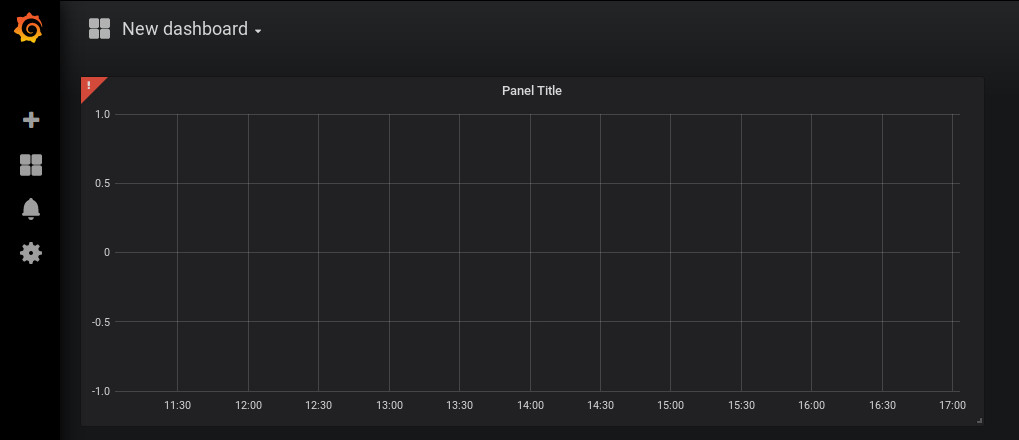
Click on the “Panel Title”, and in the drop down menu, click “Edit”. This will expand the plot to the full width of the page and present a set of tabbed menus below it.
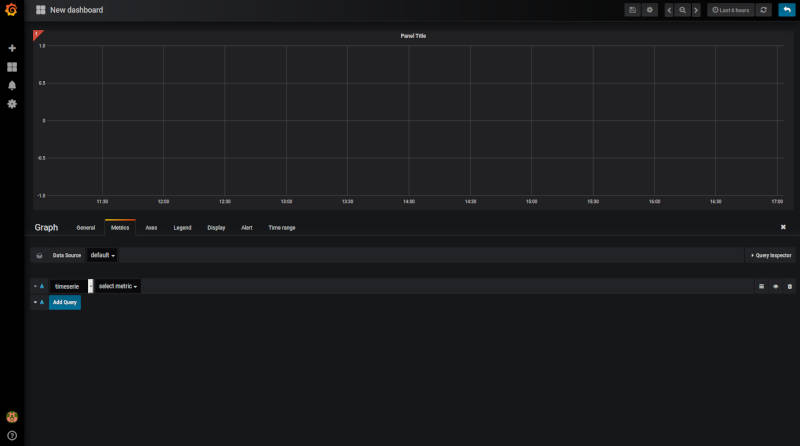
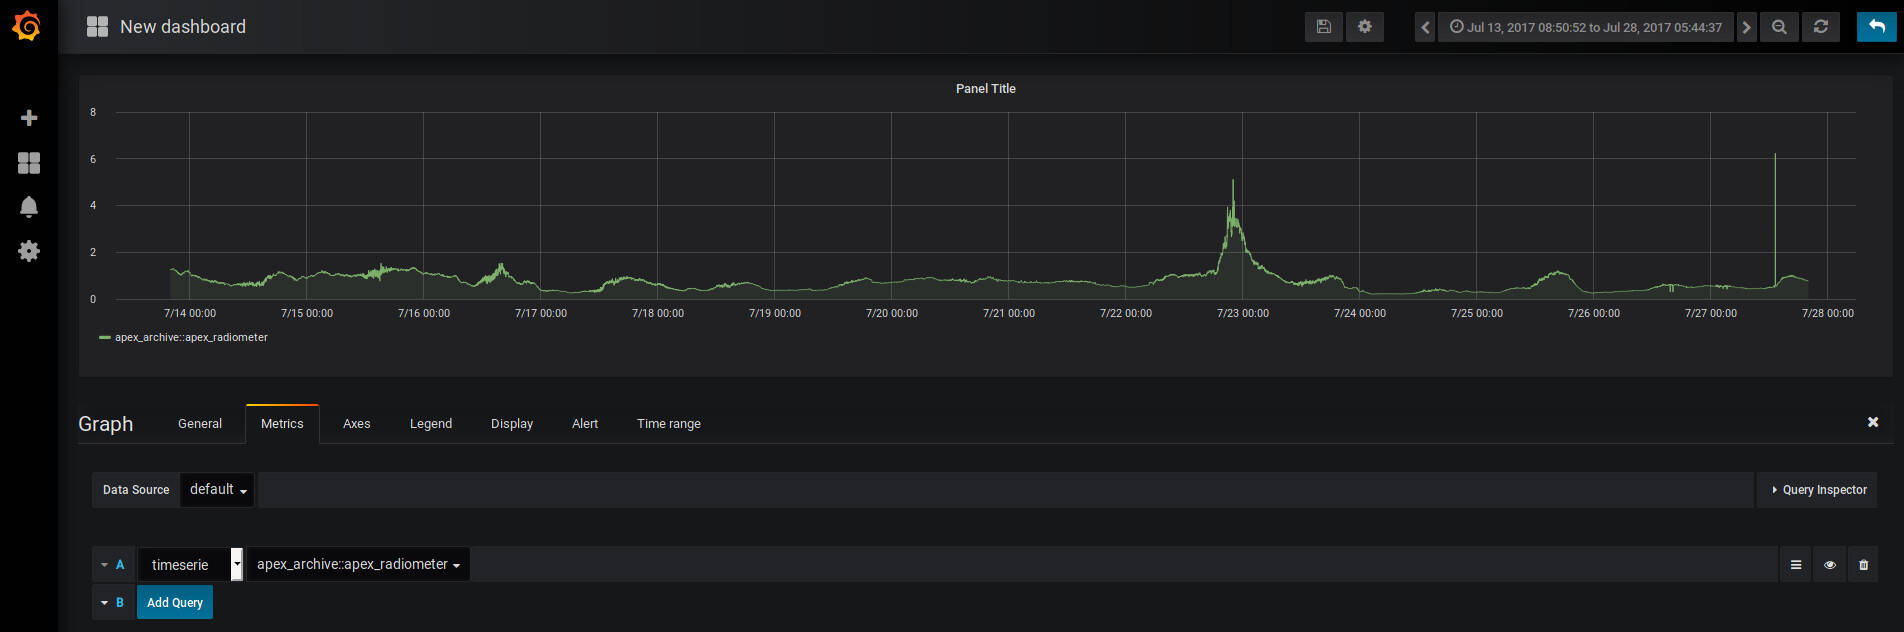
We start on the “Metrics” tab. Here is where we add the fields we wish to plot. The drop down menu that says “select metric” will contain fields populated by the sisock data servers. Select an item in this list, for instructional purposes we will select the “apex_archive::apex_radiometer” metric, which is from an example data server which contains a small sample of data to verify the live monitor is working properly. Data should appear in the plot if you are running the example weather data server container and have selected the date range between July 13, 2017 and July 28, 2017.
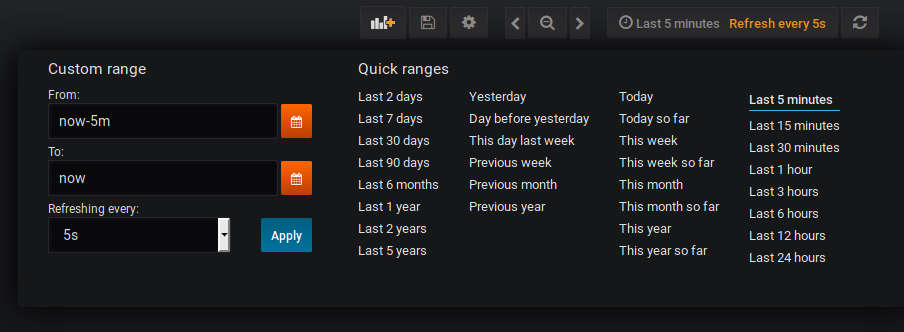
You can configure the time interval and update intervals by clicking on the time in the upper right, it most likely by default says “Last 6 hours”:
Note
The update intervals can be further customized by editing the dashboard. This can be done by clicking on the gear icon near the time settings. Keep in mind though that the more data you load the less you want to be rapidly querying the backend for displaying it. Performance may be impacted if you query large datasets rapidly.
Viewing the Live Monitor
Now we should start to see data in our live monitor.
Warning
If no data is showing up, you may have to select the metrics drop down menu again when first starting up. This is a known bug. Selecting the metric drop down should get data showing again. This is likely only a problem after you have a configured panel and restart the live monitor containers.
Here are some examples of what fully configured panels may look like:
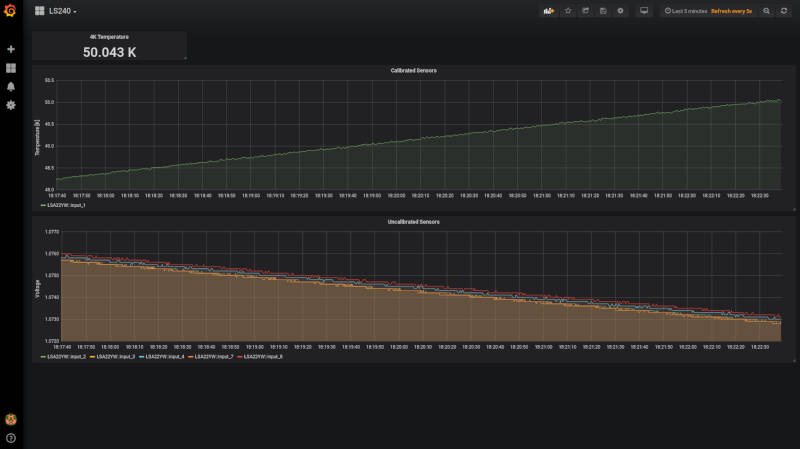
The diode calibration setup at Penn. Six diodes are readout on a single Lakeshore 240. The top plot shows the calibrated diode, reporting temperature in Kelvin. While the bottom plot shows the 5 uncalibrated diodes. The Top element is a SingleStat panel which shows the current temperature of the 4K plate via the calibrated diode.
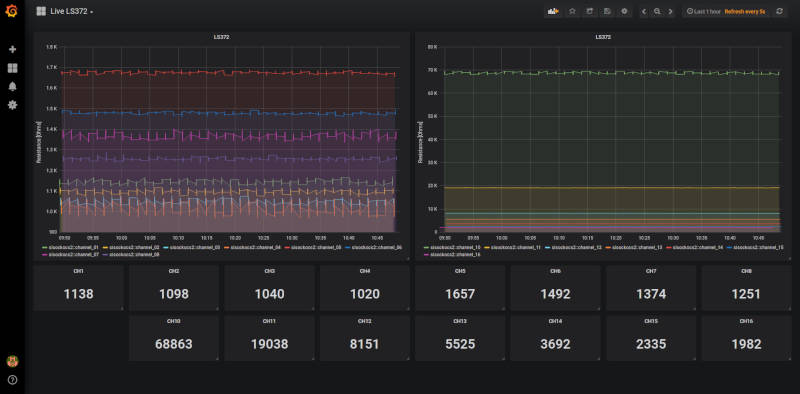
A demo Lakeshore 372 readout at Yale. The Lakeshore switches over 15 channels, reading each out for a few seconds before moving onto the next. Here the first eight channels are shown on the left plot, and the last seven shown on the right plot. There are 15 single stat panels below the plots showing the current values for each given channel.